Brain connectivities
Note:
Colab users must ensure to install matplotlib via apt-get with the following command:
!apt-get install python3-matplotlib[3]:
from gcpds.visualizations.connectivities import CircosConnectivity
The channels that are used to display the connectivities:
[4]:
channels = ['Fp2', 'C4', 'T4', 'T6', 'O2', 'O1', 'T3', 'T5', 'C3', 'Fp1']
The areas are used to group a set of electrodes:
[5]:
areas = {
    'Frontal': ['Fp2'],
    'Central': ['C4'],
    'Temporal': ['T4', 'T6'],
    'Occipital': ['O2'],

    'Occipital_': ['O1'],
    'Temporal_': ['T5', 'T3'],
    'Central_': ['C3'],
    'Frontal_': ['Fp1'],
}
Random conectivities values:
[6]:
N = len(channels)  # channels

connectivities_s = np.random.normal(size=(N, N))  # Matrix form
connectivities_s.shape
[6]:
(10, 10)
[7]:
connectivities_v = connectivities_s[np.triu_indices(N, k=1)].reshape(-1)  # vector form
connectivities_v.shape
[7]:
(45,)
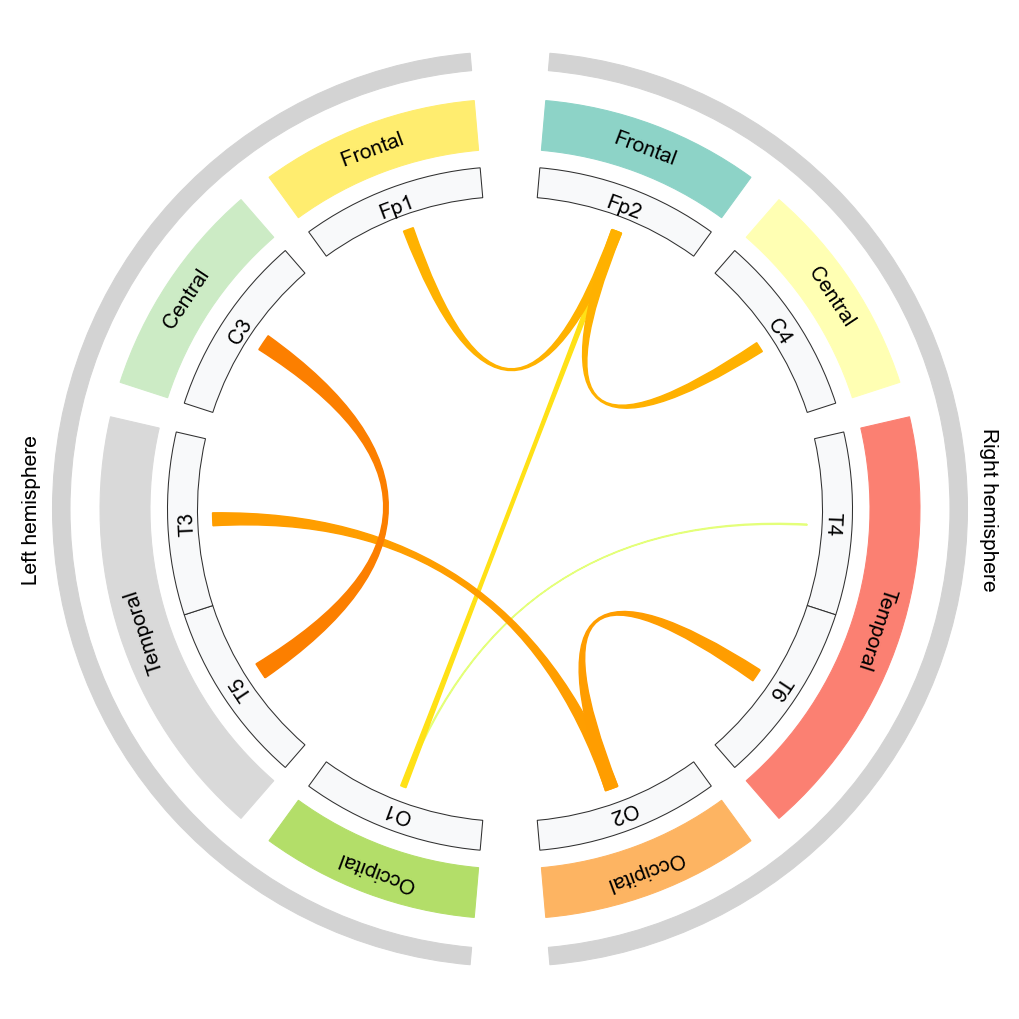
Inter-hemispheric plots
[8]:
conn = CircosConnectivity(
    connectivities_v, channels, areas=areas, threshold=0.7,

    # cmaps and themes
    areas_cmap='Set3',
    arcs_cmap='Wistia',
    hemisphere_color='lightgray',
    channel_color='#f8f9fa',
    min_alpha=0,


    # Texts
    width={'hemispheres':35, 'areas':100, 'channels':60},
    text={'hemispheres':40, 'areas':20,  'channels':40},
    separation={'hemispheres':10, 'areas':-30, 'channels':5},
    labelposition={'hemispheres':60, 'areas':0, 'channels':-10},
    size=10,
    labelsize=15,


    # Shapes
    show_emisphere=True,
    arcs_separation=30,
    connection_width=0.1,
    small_separation=5,
    big_separation=10,
    offset=0,
)

conn.figure;
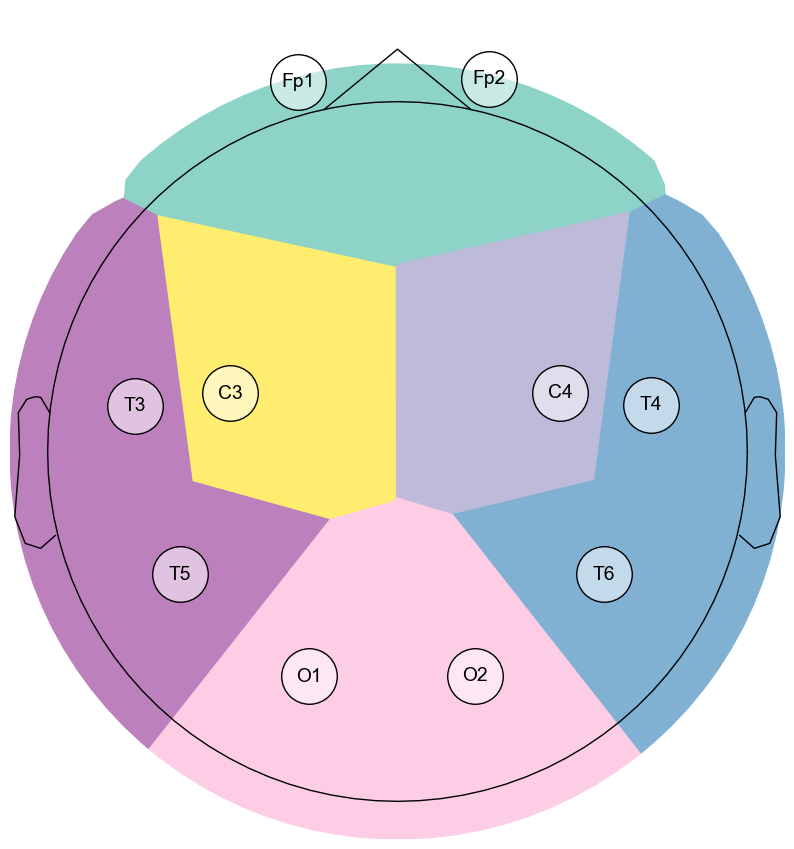
Topoplot reference:
[9]:
conn.topoplot_reference(
    montage_name='standard_1005',
    size=10,
    fontsize=20,
    markersize=40,
    markerfacecolor='#ffffff88',
    markeredgecolor='#000000',
)
[9]:
<Axes: >
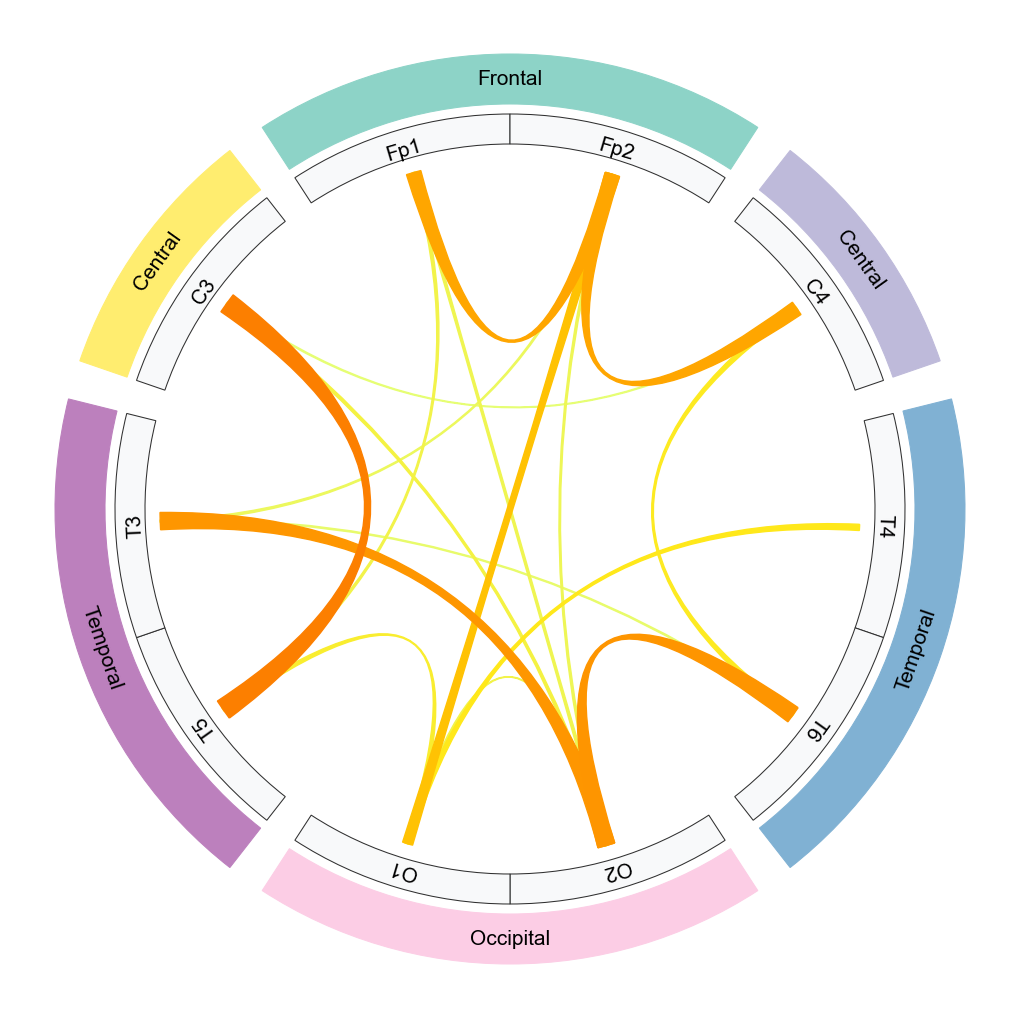
Cross-hemispheric plot
[10]:
areas = {
    'Frontal': ['Fp1', 'Fp2'],
    'Central': ['C4'],
    'Temporal': ['T4', 'T6'],
    'Occipital': ['O2','O1'],
    'Temporal_': ['T5', 'T3'],
    'Central_': ['C3'],
}
[11]:
conn = CircosConnectivity(
    connectivities_v, channels, areas=areas, threshold=0.3,

    # cmaps and themes
    areas_cmap='Set3',
    arcs_cmap='Wistia',
    hemisphere_color='lightgray',
    channel_color='#f8f9fa',
    min_alpha=0,


    # Texts
    width={'areas':100, 'channels':60},
    text={'areas':20,  'channels':40},
    separation={'areas':-30, 'channels':5},
    labelposition={'areas':0, 'channels':-10},
    size=10,
    labelsize=15,


    # Shapes
    show_emisphere=False,
    arcs_separation=30,
    connection_width=0.1,
    small_separation=5,
    big_separation=10,
    offset=-1,
)

conn.figure;
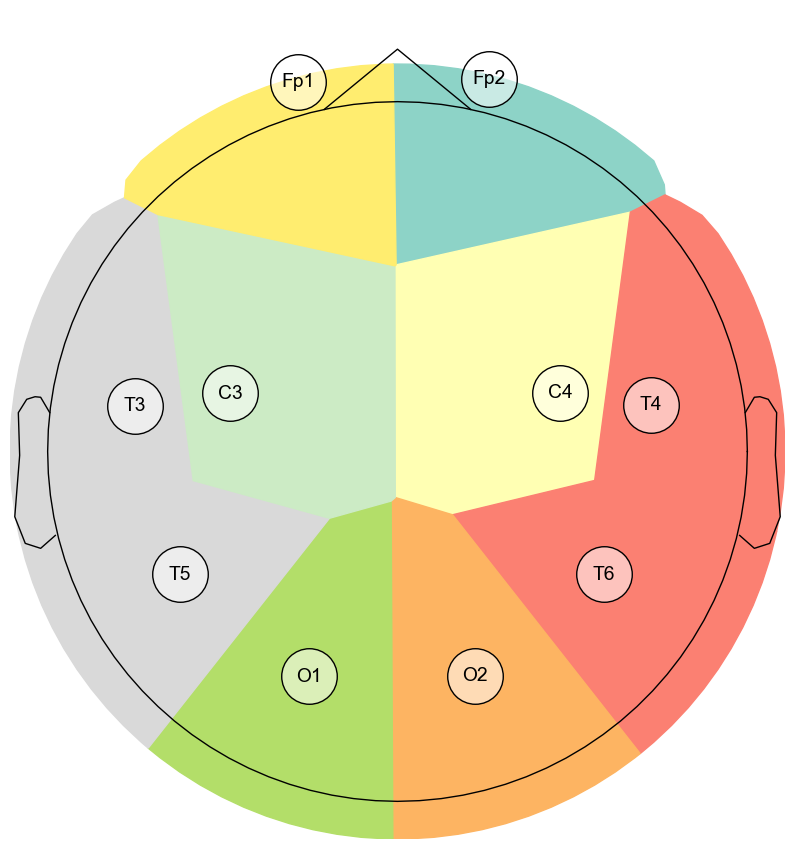
[12]:
conn.topoplot_reference(
    montage_name='standard_1005',
    size=10,
    fontsize=20,
    markersize=40,
    markerfacecolor='#ffffff88',
    markeredgecolor='#000000',
)
[12]:
<Axes: >