EEG topoplots
[3]:
from gcpds.visualizations.topoplots import topoplot
[4]:
channels = ['Fp1','Fpz','Fp2',
            'F7','F5','F3','F1','Fz','F2','F4','F6','F8',
            'C5','C3','C1','Cz','C2','C4','C6',
            'P7', 'P3','P1','Pz','P2','P4','P8',
            'O1','Oz','O2',
            'Iz']

data = np.random.normal(size=len(channels))
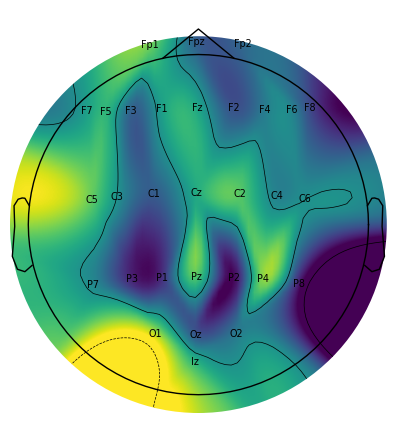
[5]:
ax = topoplot(data, channels, contours=3, cmap='viridis_r', names=channels, sensors=False)
ax.get_figure();
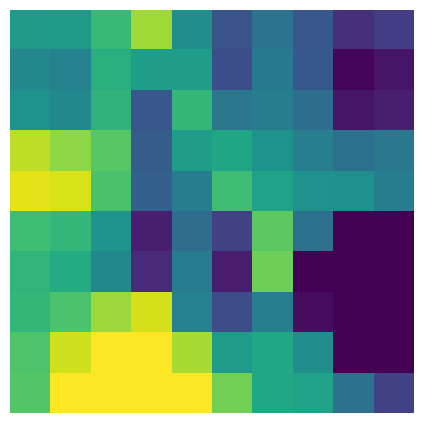
[18]:
ax = topoplot(data, channels, cmap='viridis_r', res=10, sensors=False, show=False, contours=0, outlines=None)
ax.get_images()[0].set_interpolation('none')
ax.get_figure();