EEG plot
[3]:
from gcpds.visualizations.series import plot_eeg
Input data:
[4]:
channels = ['Fp1','Fpz','Fp2',
            'F7','F5','F3','F1','Fz','F2','F4','F6','F8',
            'C5','C3','C1','Cz','C2','C4','C6',
            'P7', 'P3','P1','Pz','P2','P4','P8',
            'O1','Oz','O2',
            'Iz']

sample_rate = 250
[5]:
data = np.random.normal(size=(len(channels), sample_rate*5))
data.shape
[5]:
(30, 1250)
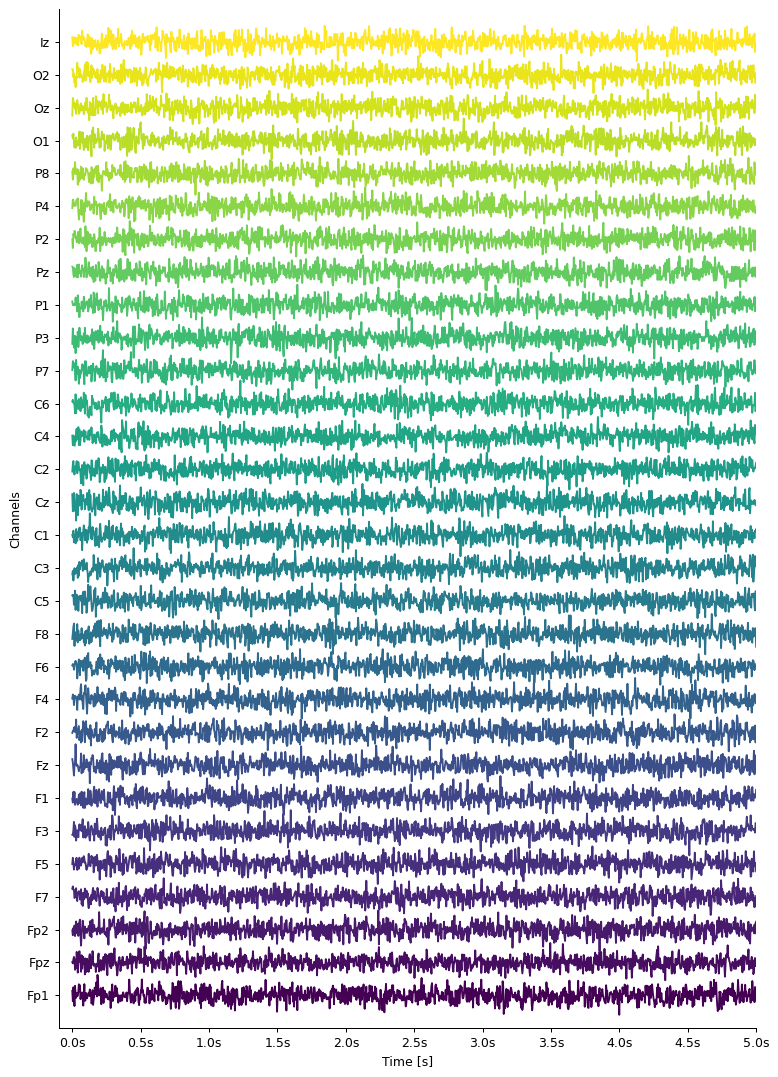
Plot arguments
[10]:
plot_eeg(
    data, channels, sample_rate,

    # color theme
    cmap='viridis',

    # axis options
    nxlabel=10,
    sca=0.7,
    offset=-0.1,

    # figure options
    fig=None,
    ax=None,
    size=(10, 15),
    dpi=90

);
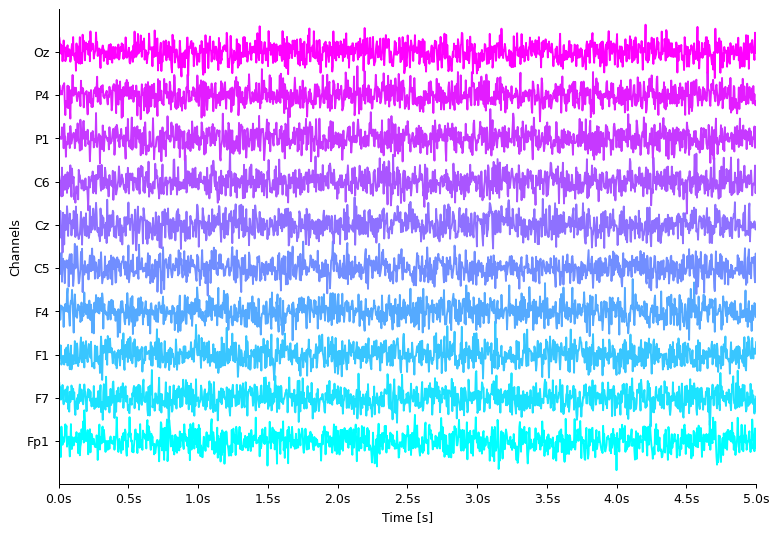
Colors
[11]:
plot_eeg(
    data[::3], channels[::3], sample_rate, size=(10, 7), sca=0.8,

    # color theme
    cmap='cool',
);
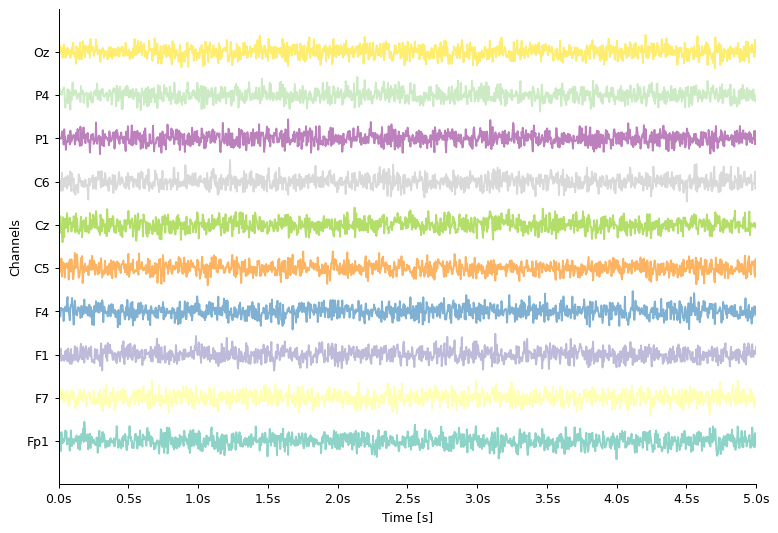
[15]:
plot_eeg(
    data[::3], channels[::3], sample_rate, size=(10, 7), sca=0.5,

    # color theme
    cmap='Set3',
);
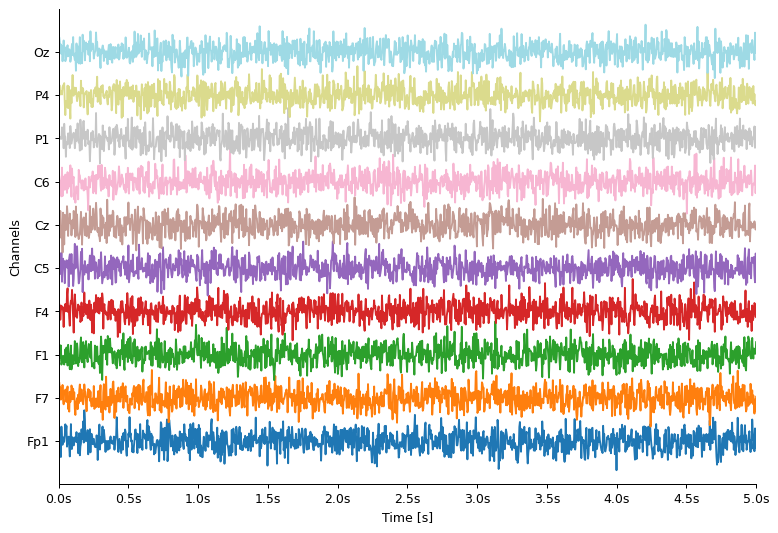
[13]:
plot_eeg(
    data[::3], channels[::3], sample_rate, size=(10, 7), sca=0.8,

    # color theme
    cmap='tab20',  # default
);